
Chile Flood and Drought Monitor Created
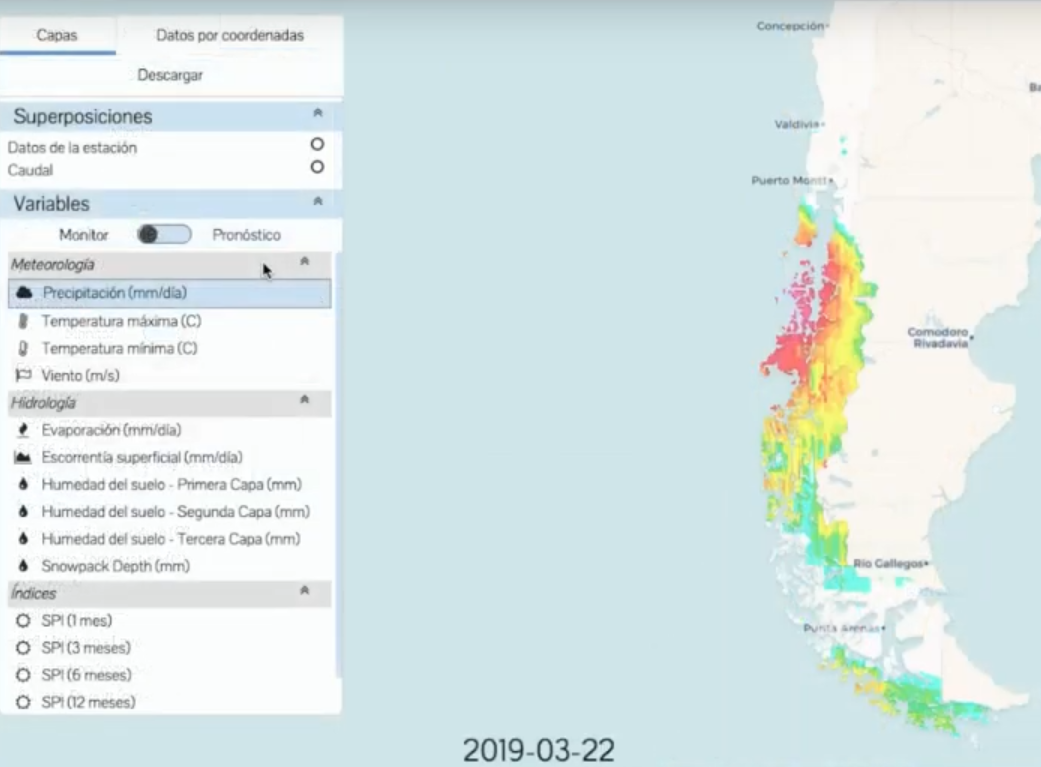
Example image of daily precipitation for Chile. Source: Princeton Climate Analytics; https://www.youtube.com/watch?v=WqBhcOi5Pmc .
Princeton University’s Latin America Flood and Drought Monitor, which ICIWaRM and UNESCO IHP and its G-WADI program helped develop, has now been adapted for the first time to an individual country.
The Chile Flood and Drought Monitor, developed by Princeton Climate Analytics, is a high-resolution and user-friendly platform that integrates local station information that provides historical, near-real time and forecast data. It uses satellite driven rainfall data to drive a vector-based river routing model. The user can display and animate 15 different variables and overlays over daily, monthly and yearly timescales. Ground-based data can also be displayed.
A video demonstration of the model is viewed at https://www.youtube.com/watch?v=WqBhcOi5Pmc.